The rider's blind spot
Potholes, debris, glass, blocked bike lanes, bad surfaces, and close-passing cars are dangers you often only register the moment they hurt you.

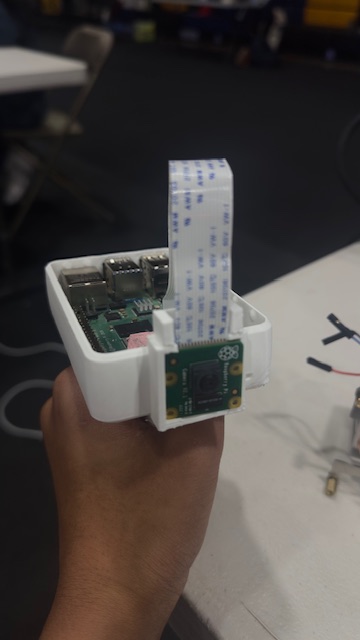
A handlebar camera and sensor that captures road hazards as you ride — turning thousands of rides into a live safety map cities have never had.
See the road cities can't.
2
Blind spots solved
Rider + city
<1s
Flag to capture
Photo + GPS + timestamp
≥1Hz
GPS track rate
Full ride polyline
100s
Demo loop
Capture to impact
Potholes, debris, glass, blocked bike lanes, bad surfaces, and close-passing cars are dangers you often only register the moment they hurt you.
Planners have almost no granular, ground-truth data on where cycling is dangerous. Streets get fixed based on crashes and complaints — not the near-misses riders face every day.
Most cycling danger isn't at famous intersections — it's on everyday roads where cities lack real-time hazard data. Blind Spot generates that data automatically.
Cycling danger is concentrated, measurable, and chronically under-reported. Better data leads directly to safer roads, more riders, and lower emissions.
~1,000
U.S. cyclists killed each year
In motor-vehicle crashes
120K
Cyclist injury ER visits annually
Crash-related, U.S.
59%
Of cyclist deaths away from intersections
On ordinary road segments
3×
Road-surface crashes hit cyclists more
Vs. other road users
91%
Fewer bike injury crashes
On one protected-lane corridor
+18%
More cycling after protected lanes
Across 72M bike-share trips
Where danger lives
Most serious cycling crashes happen on everyday road segments, and nearly a third involve overtaking vehicles — exactly the near-misses cities never see.
The data gap
The U.S. DOT created bicycle-safety performance measures because agencies need better cyclist data. Blind Spot generates that ground-truth data automatically.
Why now
Recent research shows crowdsourced cycling data can accurately model citywide cycling activity even when official counts are limited — validating the whole model.
Blind Spot turns every bicycle into a mobile infrastructure sensor — giving cities the real-time safety and accessibility data they need to make cycling safer, increase ridership, and accelerate sustainable transportation.
The handlebar hardware is just the capture layer. The real product is the collective map that turns thousands of rides into something a city could never see alone.
The bike notices danger so the rider doesn't have to. A single button and a forward-facing camera turn every ride into structured, geo-tagged data — no extra sensors required.
Computer vision turns raw frames into labeled hazards automatically. The map fills itself, not just from manual reports.
Crowd data that stays fresh and trustworthy. Hazards confirm when riders re-flag them and expire when riders pass clean.
Safer routing and ride insights make contributing worth it for the individual rider, not just the city.
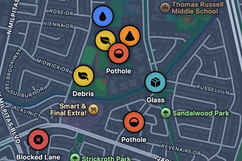
Every flag and auto-detection aggregates onto one city map: a hazard density heatmap, tappable pins with photo, type and severity, plus an accessibility layer for curb cuts, ramps and surface quality. Hazards confirm when riders re-flag them and auto-expire when they pass clean — solving the stale-data problem that kills crowd maps.
# north star · hazards mapped per active rider per week
A tangible payoff makes contributing worth it for the individual — not just the city. The same crowd data that informs planners routes you around the hazards other riders already found.
Confirmed potholes, debris, and blocked lanes on your route surface as alerts before you reach them.
Safety-first routing weighs the live hazard and surface-quality map, not just the fastest line.
Every ride returns a recap card scoring the roads you took, so contributing pays you back.
Capture layer
Raspberry Pi brain with Pi camera, push button, GPS, buzzer and LED. The camera handles both hazard and fall detection. Buffers locally in SQLite, syncs over WiFi or phone hotspot.
Processing
FastAPI ingest, a YOLOv8n detection worker on captured frames, a privacy worker that blurs faces and plates, plus aggregation, routing and export APIs.
Storage
Postgres + Auth for rides, events, hazards and confirmations. Object storage for photos and recap cards. Realtime so hazards appear live.
Consumption
Next.js + MapLibre map with hazard, accessibility and heatmap layers, ride history, recap cards, confirm UI and safety-first routing.
Data flow · one ride
Why it matters
More riders means more capture, a denser and fresher map, more value — and more riders. Every bike becomes a sensor.